
If ITE meetings are where the engineers and planners gather, ATSIP and GSA are where the data people and state safety leaders converge. In summer 2025, I attended both — ATSIP in Boston (July) and the Governor’s Safety Association conference in Pittsburgh (August). Together, they gave me a complete picture of the data-to-action pipeline in transportation safety.

At ATSIP in Boston — where traffic records professionals shape the foundation of every safety decision.
ATSIP Boston: The Data Foundation
The Association of Transportation Safety Information Professionals (ATSIP) conference is unlike any other safety conference I’ve attended. While most events focus on the analysis and outcomes, ATSIP focuses on what comes before: the data itself.
These are the professionals who design crash report forms, build and maintain state crash databases, manage data quality programs, and create the linkage systems that connect crash records to road inventories, hospital records, and driver files.
Three sessions particularly shaped my thinking:
Crash Data Completeness Is a Spectrum
A recurring theme was that no crash database is perfect — and that’s okay, as long as you understand the gaps. Some states have 95% geocoding rates; others are at 60%. Some capture detailed roadway characteristics on the crash form; others don’t. The key is building analysis tools that are honest about data quality and help users understand what their data can and can’t tell them.
Linking Methods Matter Enormously
How you connect crashes to road segments determines everything downstream. LRS-based linking (using mileposts) and spatial linking (using GPS coordinates) each have strengths and failure modes. Several presentations demonstrated cases where different linking methods produced different High Injury Networks from the same crash data. This validated our approach of supporting both methods and auto-detecting which one works best for each client.
The Push Toward Real-Time
Multiple states are building near-real-time crash data pipelines — crash reports flowing into databases within days rather than months. This changes the game for analysis tools. Instead of working with 3-year rolling averages of stale data, agencies will soon be able to identify emerging patterns as they develop.
→
Database
→
Quality Check
→
Linkage
→
Analysis
→
Action
GSA Pittsburgh: The Strategic View
A month later, I was in Pittsburgh for the Governor’s Safety Association conference. If ATSIP is about the data foundation, GSA is about the strategic layer — how state-level leaders translate data into policy, programs, and funding decisions.
Pittsburgh — the Steel City — proved to be the perfect setting for conversations about building stronger safety infrastructure.
Dashboard Fatigue Is Real
One standout presentation tackled a problem I’ve heard about in private conversations but rarely see discussed openly: dashboard fatigue. Agencies have invested in data visualization tools, but many dashboards go unused because they answer questions nobody is asking. The presenters argued for starting with the decision, then building the data view — not the other way around.
The Future State Is Unified
A compelling vision was presented for what the next generation of safety operations looks like: a unified platform where planners, analysts, and field engineers all work from the same data, with role-appropriate views. No more exporting CSVs from one system to import into another. No more “the crash data lives in system A but the road inventory is in system B.” This vision maps directly to what we’re building with Roadway Insights.
PA’s Safety Office Model
Pennsylvania’s presentation on their safety office structure — separating crash data programs, highway safety, and engineering safety while keeping them connected through shared data — was a model of how states can organize for effectiveness. It reinforced that our platform needs to serve multiple user personas within the same agency.
How These Conferences Shaped Our Platform
ATSIP and GSA together gave me a top-to-bottom view of the safety data ecosystem. The insights directly influenced several product decisions:
- Data quality indicators — We’re building transparency about geocoding rates, linking success rates, and completeness metrics into every analysis module
- Flexible linking methods — Our platform auto-detects whether LRS or spatial linking works best, and we’re adding tools for users to override and correct individual linkages
- Decision-first dashboards — Instead of generic “here’s your data” visualizations, we’re designing around the questions agencies actually need to answer
- Role-based experiences — The same platform, but with views tuned for analysts, planners, and decision-makers
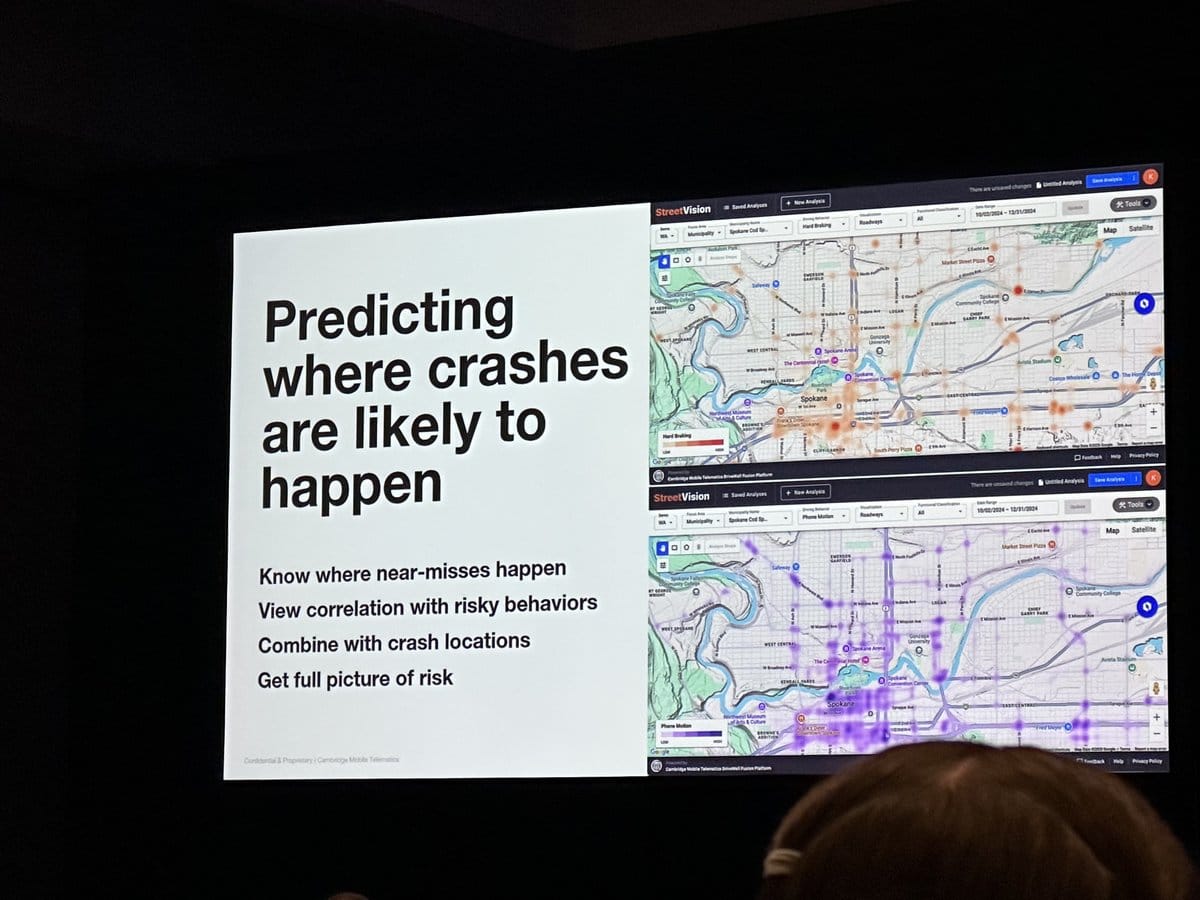
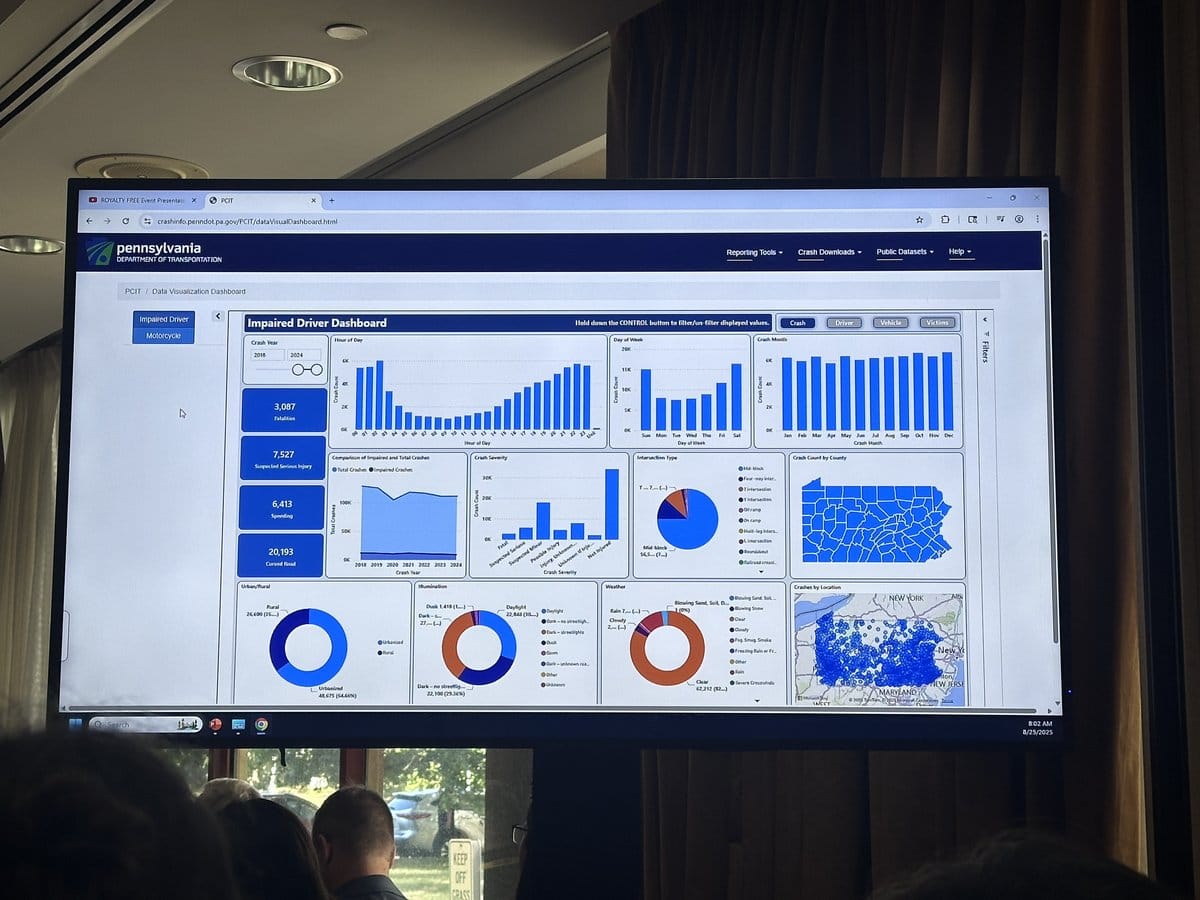
Left: Crash prediction analytics at ATSIP. Right: Safety dashboard evolution at GSA — both pushing the field forward.